By Lumi Adisa, Managing Partner, Amplink Technologies
South Australia’s recent wind droughts make clear that weather is now one of the most powerful determinants of market value.
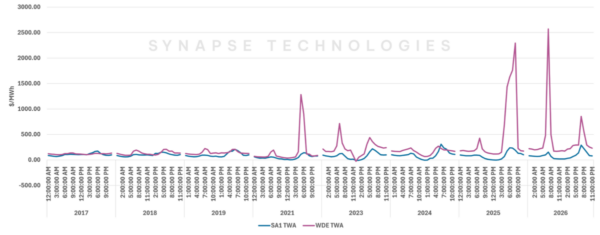
Wind drought events sent the morning peak-price average up to $2570/MWh in 2026 while the evening peak hit $2292/MWh during 2025 wind droughts. Given this, we compared wind events over the last decade, examining their new-found capacity to utterly transform revenue dynamics.
A decade ago, several calm wind days barely moved the needle. Gas was a system mainstay then, prices were relatively stable, and renewables contributed far less.
Today, the same weather pattern creates a radically different market.
Related article: Victoria approves biggest wind farm in Southern Hemisphere
Now, when the wind disappears, gas has to shift from the ‘ramp and flexibility participant’ to the ‘essential baseload supplier.’ As such, prices depart sharply from normal trading conditions and hundreds of millions of dollars of revenue are redistributed in just a few days.
To demonstrate these dynamics, we compared two South Australian datasets.
The first dataset isolates what we’re calling Wind Drought Events (WDE)—periods when South Australia’s wind fleet generated less than 10% of its capacity factor for at least three consecutive days. These are intentionally conservative parameters. They exclude shorter low-wind episodes and days when wind was subdued but above the 10% threshold, allowing the analysis to focus on only the most severe and sustained weather-driven scarcity events. By filtering out transient fluctuations, the observed commercial impacts can be more confidently attributed to wind droughts themselves.
The second dataset simply looks at every trading day throughout the year, providing the baseline against which events can be measured.
Comparing the two reveals just how differently the market behaves when a resource on which South Australia depends disappears.
South Australia is increasingly built around the assumption that the wind will blow
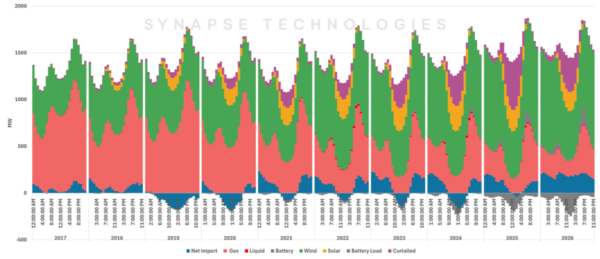
In the past decade, the rapid growth of rooftop PV, utility-scale solar and wind has transformed South Australia’s electricity system. This trio has steadily displaced much gas generation, changing the fuel from a primary energy source into a flexible backup that now operates mostly in the morning and evening shoulders around solar-driven ramps.
Wind has now become the presiding supplier, while grid-scale (and rooftop—though not shown in Figure 2) solar dominate the daylight hours. At times, renewable output even exceeds what the system can absorb, driving significant curtailment. The consequence is gas generation is smaller in absolute terms, and also increasingly concentrated into periods when the system most needs flexibility.
The supremacy of wind generation in South Australia has baked in a dependence on a resource that behaves very differently to material fuel sources. Since wind droughts previously occurred without fanfare, we need to look to historical records to assess their frequency.
Extreme wind droughts are not once-in-a-decade events
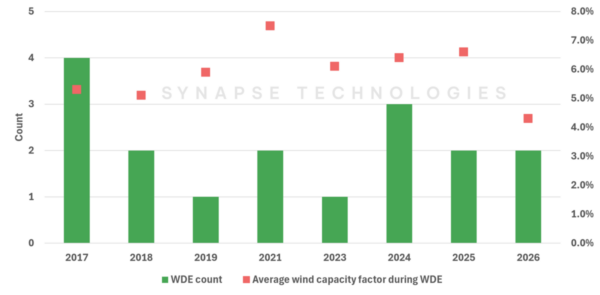
Rather than looking at every low-wind day, Figure 2 deliberately focuses on only the most severe events.
Since the Wind Drought Events (WDE) we are assessing last at least three consecutive days, these are long enough for changes in dispatch, pricing and revenues to persist across multiple trading cycles, making them far more relevant from an investment perspective than isolated low-wind days.
The distribution of these WDE reveal several interesting patterns.
Firstly, they overwhelmingly occur in autumn and winter, with all observed events happening in these seasons (41% in June alone).
Secondly, they’re surprisingly common. Since 2017, South Australia has averaged around two events that qualify as WDE each year. The exceptions are 2020 and 2022, where no period satisfied the extreme threshold. Importantly, because WDE are defined by both severity (<10% capacity factor) and persistence (at least three consecutive days), they should be viewed as a lower bound on wind-driven scarcity. Many shorter periods of low wind—and even multi-day events with capacity factors marginally above 10%—would almost certainly have influenced prices and generator revenues.
Finally, while WDE occur most years, they are not equally severe.
Even though 2017 saw the highest number of WDE (four events, lasting a total of 13 days), the 2026 WDE was the deepest wind drought observed, recording the lowest average wind capacity factor of the entire analysis period (last decade) at just 4.3%. The two recorded WDE for 2026 lasted a total of seven days, with the most recent event lasting four days towards the back end of June.
With historical records establishing that WDE are neither isolated nor rare, the pertinent question then becomes how the market responds when they arrive.
The cost of calm
In the earlier years of South Australia’s energy transition, wholesale prices during WDE closely tracked those observed during normal trading. Gas was, at that time, still a regular part of the generation mix, meaning the loss of wind had a relatively modest impact on dispatch and pricing.
That relationship has since broken down, as Figure 3 demonstrates.
As rooftop PV hollowed out daytime demand and wind increasingly displaced gas across the rest of the day, gas transitioned from being a mainstay energy provider to a flexible resource. Gas now operates less often, and rebounds mostly when the market places the greatest value on dispatchable generation.
During WDE, gas is called on to meet residual demand and, because it is filling a supply gap, it sets the wholesale price across a much larger share of trading intervals.
The result is a widening premium between WDE prices and normal market prices, particularly through the morning and evening peaks where dispatchable generation becomes indispensable.
The past two years illustrate this most clearly, recording average WDE morning and evening peak prices of $2570/MWh and $2292/MWh, the highest observed across the 10-year period of this analysis.
One of the defining characteristics of an energy-only market is that, by design, returns are not doled out evenly. Rather, they concentrate in periods of scarcity. Given this, which technologies are best positioned to capture it?
The value of showing up: availability is everything
Figure 4 compares the generation-weighted average price (GWA) received by each technology—that is, the average wholesale price earned for every MWh it generates.
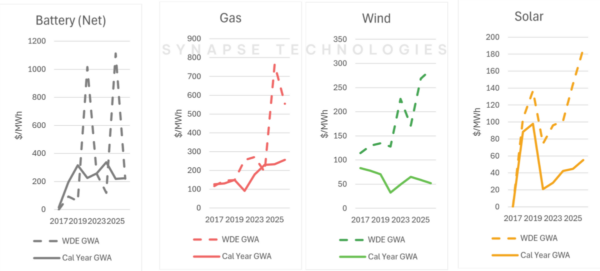
Gas is the clear beneficiary of wind drought events with an average GWA of $659/MWh over the lpast two years—about 2.5 times its average for calendar years 2025 and 2026.
Unlike most technologies, it benefits from two powerful tailwinds simultaneously—higher prices and higher production. The periods when gas needs to generate the most electricity are some of the highest-priced periods of the year.
Solar also performs remarkably well during wind droughts with a GWA of $165/MWh, also more than three times its yearly average for 2025 and 2026.
Winter wind droughts sometimes occur on days with relatively clear skies, allowing solar farms to produce relatively well while wholesale prices remain elevated. As a result, solar’s captured prices during wind drought events significantly outperform their annual averages.
Perhaps the biggest surprise is wind itself. Its GWA of $278/MWh during wind droughts is five times its average of the past two years. This is particularly noteworthy given that wind’s annual GWA has been on a downward trend, declining by approximately 38% over the last decade due partly to ‘self-cannibalisation.’
Although total wind production falls dramatically during WDE, the wind generators that remain earn a significant premium. For projects located outside the worst weather systems, relatively modest output can still generate attractive revenues. As annual wind GWAs continue trending downward in the state, these anomalies become increasingly valuable, reinforcing the importance of geographic diversity when building wind portfolios.
Batteries tell a more complicated story.While their generation-weighted prices appear attractive, revenues depend equally on charging costs. Windy days typically provide much cheaper energy to charge from, meaning the arbitrage opportunity during extreme wind droughts isn’t always superior once both sides of the trade (charging and discharging) are considered.
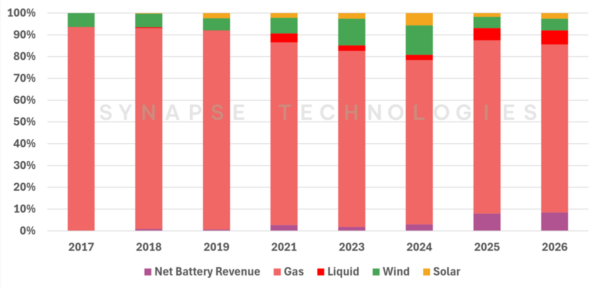
As seen in Figure 5, across a total of 17 WDE in the past decade, gas has cumulatively earned approximately $340 million, 53% of which was earned in the past two years alone. In 2025 and 2026, gas captured around 80% of total market revenue during WDE compared with about 50% across a normal trading year.
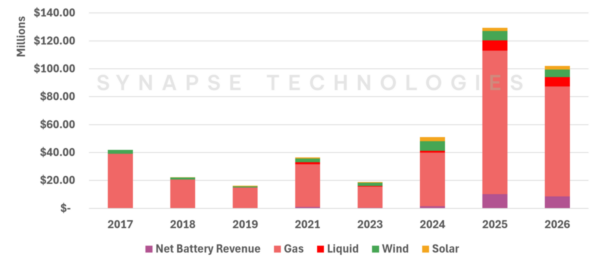
Looking at how dramatically market revenues redistribute during WDE, it is clear that dispatchable generators (gas and liquids) pick up the lion’s share of the revenues left by wind.
Wind’s share of total market revenue in the same period falls from 32% to just 5%, reflecting the sharp decline in fleet-wide output.
Related article: Construction begins at Palmer Wind Farm in South Australia
However, this masks an important nuance. A small number of non-correlated wind farms continue to generate modestly during these events, earning significant revenues despite the broader wind drought. This highlights the importance of asset location and considering weather diversity during portfolio construction.
Liquid fuel generators also experience a remarkable resurgence during wind droughts, roughly doubling their normal revenue share as extreme prices justify operation that would otherwise be uneconomic.
Investors should be paying attention to the calm
The recent South Australian wind drought reinforces a broader investment trend. As renewable penetration increases, revenues are becoming increasingly concentrated into short periods of scarcity. Understanding how assets perform during these—not just across an average year—is an ever more important part of portfolio assessment. As power systems become more weather-dependent, understanding these interactions will become just as important as understanding the assets themselves.